United States Department of Agriculture
AgResearch Magazine


What Do We Eat in America?
-
 On any given day, about 13 percent of Americans eat pizza. (Scott Bauer, K7633-3)
 -
 Research leader Alanna Moshfegh reviews nutrition data derived from the What We Eat in America survey. (Peggy Greb, D3939-1)
 -
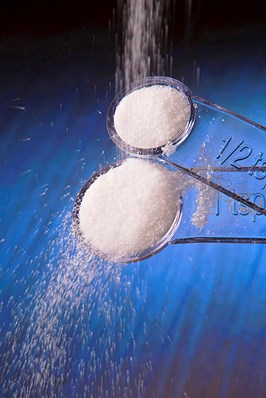
 Between 2004 and 2014, Americans reduced their intake of added sugar by 3.6 teaspoons a day. (Peggy Greb, D3583-1)
 -
 Two-thirds of infants had not been breastfed on the day the mothers were interviewed for the What We Eat in America survey. (Jack Dykinga, K3095-10)
Have you ever wondered how much pizza we eat? How often we eat sandwiches? Whether we’re drinking more soft drinks these days or getting too much sugar?
If such questions cross your mind, then like many of the nation’s top nutritionists you might consider the What We Eat in America Survey a font of information.
What We Eat in America is a detailed survey of a cross section of the U.S. population focused on our collective intake of all foods and beverages. It’s administered annually to 5,000 people as part of the National Health and Nutrition Examination Survey (NHANES).
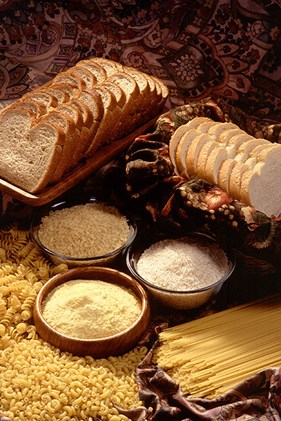 Folate fortification of breads, cereals, and other grain products reduced the rate of neural tube defects in newborns by 25 to 30 percent. (Scott Bauer, K7650-1) |
Designed by Agricultural Research Service (ARS) researchers and conducted by the National Center for Health Statistics (NCHS), which is part of the Centers for Disease Control and Prevention, the survey is one of the most widely used tools available for assessing the nation’s dietary habits—and coming up with strategies to improve on them. Researchers, nutritionists, health experts, and government agencies use the results to document shortcomings of our diets and target messages to segments of the population who need them, such as the parents of children living in poverty or people at risk of hypertension, diabetes, obesity, or other diet-related health conditions. The survey has been conducted since 2002, when previous surveys by the U.S. Department of Agriculture and the U.S. Department of Health and Human Services were integrated into one.
“The survey shows us where we’re doing well and where we’re falling short in terms of the Dietary Guidelines for Americans so that we’re better informed about what we’re eating and better equipped to address areas for improvements,” says Alanna Moshfegh, research leader of the ARS Food Surveys Research Group, which developed the survey along with NCHS scientists. Moshfegh and her ARS colleagues also sift through survey data and generate reports focused on the nation’s changing appetites for everything from soft drinks and sandwiches to pizza. (See Bonus Content).
No Shortage of Customers
A number of agencies and researchers also tap into the results. The U.S. Food and Drug Administration (FDA) uses them to update the information that appears on our food labels, such as serving sizes. The U.S. Environmental Protection Agency uses them to evaluate our risk of exposure to pesticide residues left on some foods in trace amounts.
|
|
“We use the What We Eat in America survey results every day. We couldn’t do without them,” says Johanna Dwyer, a senior nutrition scientist at the National Institutes of Health’s Office of Dietary Supplements and a professor of health and nutrition at Tufts University School of Medicine in Boston.
The results can also raise fresh sets of questions about the nation’s evolving dietary habits and spawn additional research. “We might compare the results to findings from similar, smaller studies and use them to generate hypotheses that we then put to the test,” says Theresa Nicklas, a professor and researcher at the ARS Children’s Nutrition Research Center at the Baylor College of Medicine in Houston.
Nicklas recently found that despite repeated recommendations for mothers to breastfeed their infants, two-thirds of infants (aged up to a year) had not been breastfed on the day that the mothers were surveyed. In another study, she found that children under 2 in low-income homes were less likely to be breastfed and more likely to be given sweetened beverages—which is not consistent with longstanding recommendations—than children in higher income homes. Both studies note that there are a number of reasons why mothers may not be able to breastfeed their infants, that children develop food preferences early in life, and that there is a need for more outreach to underserved communities.
“What We Eat in America has advanced the science of nutrition tremendously,” Nicklas says.
A Survey That Serves Us Well
As with any survey that depends on personal recall, there are caveats to the survey, researchers say.
“We have to be cautious when looking at the caloric intakes that are reported in the survey because people will always have a hard time remembering what they ate,” Nicklas says. “People who are overweight tend to under-report their caloric intake.”
Moshfegh says the survey is specifically designed to get people to recall what they ate as accurately as possible, and the methods have been validated in scientific studies. “The survey is designed to prod those memories in a series of carefully designed prompts,” she says.
For the survey, NHANES Mobile Examination Center trailers visit 15 sites around the country, and staff ask approximately 5,000 survey participants per year to report everything they ate and drank in the past 24 hours. Participants are carefully selected to represent a cross section of the U.S. population and are interviewed twice: initially face-to-face and in follow-up telephone sessions. Cups, bowls, and spoons help participants determine portions consumed, and a Food Model Book contains drawings to help individuals estimate the amounts they ate and drank.
Interviewers use a computerized questionnaire and prompt subjects to try to recall any forgotten foods, the times they ate each food, and details about each eating occasion. The approach was developed by ARS scientists and is known as the Automated Multiple-Pass Method. It has been validated by scientific studies and adopted in some form by nutrition researchers in Australia, Israel, South Korea, and Nigeria, as well as by private-sector firms that collaborate with ARS for use of the required software and training.
Researchers say that the survey is an important tool for other government agencies responsible for coming up with nutrition policies that can essentially save lives and reduce health care costs. For example, since the FDA began requiring folate fortification of breads, cereals, and other grain products in 1998, rates of neural tube defects that cause spina bifida in newborns have declined by 25 to 30 percent. On the other hand, too much salt in the diet can raise blood pressure, which is a major risk factor for heart disease and stroke. One in three Americans has high blood pressure, and scientists say that reducing the nation’s average sodium intake to 2,300 milligrams (mg) per day would prevent between 280,000 and 500,000 premature deaths over 10 years. Americans consume an average of 3,400 mg of sodium per day.—By Dennis O’Brien, ARS Office of Communications.
_______________________________________________________________________________
|
|
Findings by the ARS Food Surveys Research Group include:
-
About one in five people (18 percent) doesn’t eat lunch.*
-
Teenagers now get 24 percent of their calories from snacks,* up from 14 percent in 1978.
-
On any given day, roughly half of all U.S. adults (47 percent) ate at least one sandwich.*
-
On any given day, about one in eight Americans (13 percent) ate pizza. Children eat two times and teens eat four times more pizza today than they did 30 years ago.*
-
Consumption of sugar-sweetened soft drinks per day has gone up and down. The average daily soft drink consumption was 14 ounces in 1977-78, rose to 24 ounces in 2003-2004, and dropped to 19 ounces in 2013-2014.
-
We’ve reduced our intake of “added sugar” (sugar not naturally occurring in a food) by a daily average of 3.6 teaspoons (tsp.) over the last decade, from 21 tsp. (2003-2004) to 17.4 tsp. (2013-2014) per day.
-----------------------------------------------------------------------
*2013-2014 What We Eat In America, NHANES data.
Key Facts
- What We Eat in America is a detailed survey of all foods and beverages consumed by a cross section of the U.S. population.
- The survey is administered annually to 5,000 people.
- ARS researchers designed the What We Eat in America survey.
- The survey is one of the most widely used tools available to assess the nation’s dietary habits.
Full Story