United States Department of Agriculture
AgResearch Magazine


Putting Community
|
|
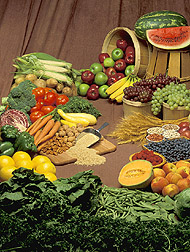 The Food Guide Pyramid recommends 3-5 vegetable servings and 2-4 fruit servings daily as part of a healthy diet and is used by Community Nutrition Research Group staff to determine who meets minimum daily servings recommendations. (K7181-2) |
ARS' Community Nutrition Research Group (CNRG) was established 3 years ago as one of seven units of the Beltsville (Maryland) Human Nutrition Research Center. Traditionally, ARS' applied nutrition efforts have centered on bringing people into human nutrition research centers for volunteer studies. But CNRG's nutritionists, home economists, and a statistician also reach out to—and into—various communities. "By learning about the dietary needs of communities, the lab can provide sound data to support applied nutrition policies and programs," says Ellen W. Harris, the group's research leader and assistant director for nutrition monitoring at the Beltsville center. The group's mission is to monitor and assess the capacity of communities to meet their members' food and nutrition needs and to use those assessments to highlight the links between agriculture, nutrition, health, and community. "The relationship between food and chronic diseases such as obesity, diabetes, and hypertension is significant," says Harris. CNRG staff study the dietary patterns as well as the behavioral and environmental characteristics of communities in the United States to identify gaps and emerging nutrition needs within diverse groups. |
 In addition to a healthy diet, early establishment of habits like exercise can reduce risk of chronic diseases. Here, a high-school student jumps rope to keep in shape. (K10355-2) |
Nutrition by the Numbers The Continuing Survey of Food Intakes by Individuals (CSFII) is a collection of data taken from 16,000 people surveyed nationwide in homes by trained interviewers, most recently between 1994 and 1996. The survey is managed by ARS. Several CNRG staff analyze survey data to investigate dietary patterns, physical activity, and other behaviors in the United States among diverse population groups. The data has been used, for example, to examine such patterns as use of carbohydrates versus fat in diets, consumption of soda versus milk by teens, and the quality of high- versus moderate-sugar-intake diets, to name a few. Eleven percent of the 16,000 people surveyed were African American. "This sample allowed CNRG to make several important group-based conclusions," says Harris. "Within the African American community, a greater understanding of the link between nutrition, health, and quality of life is needed." In response, the CNRG, together with Morgan State University in Baltimore, Maryland, published "Food Counts in the African American Community." Thick with vital information, the publication serves as an educational resource for academicians, extension workers, health fair presenters, and church and community group workers. |
 Ellen Harris, research leader (left), and Alvin Nowverl, mathematical statistician, review data for the community nutrition mapping project. (K10354-1) |
Written for a wide audience, the 115-page paperback is made available free of charge by the lab. "We hope the book ultimately will help this community reduce its risk of diet-related diseases," says Harris. Among other themes, "Food Counts" provides an explanation of the role of atherosclerosis—a progressive disease of fat accumulation in the walls of blood vessels, especially in the heart, brain, and kidneys. African Americans show a higher prevalence of hypertension than whites and other ethnic groups. In addition, while mortality from coronary heart disease is known to increase with age, death rates among African Americans are consistently higher than among whites and other ethnic minorities, regardless of age. The book points to excessive salt intake, high alcohol consumption, physical inactivity, and obesity as factors that increase development of hypertension. To help users, the book provides handy cholesterol and blood pressure charts, as well as a body mass index table. Users can check their own numbers against the charts provided to determine their level of risk and then plan changes that will lead to better health and nutrition habits. Another way that CNRG strives to assess and forecast nutritional needs is through the Community Nutrition Mapping Project, or CNMap. The project is a collection of food and nutrition indicators obtained from a variety of sources. Through CNMap, CNRG staff strive to map community nutrition by logging indicators that reflect the nutritional health of a particular community. CNMap combines CSFII and other data with geographic information system (GIS) software to provide a picture of human nutrition, health, behavior, and environment at state and regional levels. "We use GIS to combine data from USDA's Food Stamp Program and from its Agricultural Marketing Service and Economic Research Service, in partnership with the Census Bureau," says Alvin Nowverl, CNRG's mathematical statistician. The resulting application, CNMap, was released onto the World Wide Web last year (www.barc.usda.gov/bhnrc/cnrg/cnmapfr.htm). CNMap provides data on fat, cholesterol, sodium, and macro- and micronutrient intakes, healthy eating patterns, physical activity, demographics, body weight, obesity, and more. A CNRG project called FoodLink connects foods used in USDA food surveys to information on ingredients and commodities. One FoodLink product is the Food Guide Pyramid Servings database. "Each food contains food serving(s) from one or more of the established fruit, grain, vegetable, dairy, and/or meat groupings," says Annetta Cook, home economist. "Pyramid servings data can be joined with other survey data to provide an indicator of those who do and do not meet minimum daily servings recommendations." Nurturing Youth for the Future CNRG has worked with the Centers for Disease Control and Prevention to improve the nutritional health status of students on college campuses. Two Historically Black Colleges and Universities, two Hispanic-Serving Institutions, and two Native American Tribal Colleges participated from 1999 to 2001. Focus groups consisting of faculty and students were formed. The groups worked on creative ways to stimulate better nutritional awareness. One group produced public service announcements, which were broadcast by the campus radio station. Competitions and walkathons were also organized. Now, CNRG—in partnership with Howard University in Washington, D.C.—is planning to launch a project to collect nutrition, body-measurement, and fitness data from urban children aged 10 to 16. The data will be used to develop future intervention programs to significantly improve the health, well-being, and quality of life of youth nationwide. "Findings from community nutrition studies and programs can help build a better understanding of the relationship between nutrition and health in practical ways," says Harris.—By Rosalie Marion Bliss, Agricultural Research Service Information Staff. This research is part of Human Nutrition, an ARS National Program (#107) described on the World Wide Web at www.nps.ars.usda.gov. Ellen W. Harris is with the USDA-ARS Community Nutrition Research Group, 10300 Baltimore Ave., Bldg. 005, Rm. 117, Beltsville, MD 20705-2350; phone (301) 504-0610, fax (301) 504-0698. "Putting Community Nutrition on the Map" was published in the April 2003 issue of Agricultural Research magazine.
|