United States Department of Agriculture
AgResearch Magazine


Nutrient Accountants
They keep track of constituents in the nation's foods.
|
|
For decades, epidemiologists have combed the globe studying dietary habits in countries with either a high or low incidence of heart disease and cancer—looking for relationships. Ultimately, researchers want to know specifically what food components—such as fiber and antioxidants or saturated fat and cholesterol—protect us from disease or increase our risk.
"You can't make sound dietary recommendations if you don't know what's in the foods," says Abby Ershow, nutrition program officer with the National Heart, Lung, and Blood Institute.
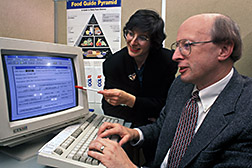
So her institute has had a longtime collaboration with two Agricultural Research Service laboratories that underpin this search for diet-health relationships. One lab maintains the National Nutrient Databank, which is published in a multivolume USDA Agriculture Handbook, "Composition of Foods—Raw, Processed, Prepared," commonly known as Handbook 8. The other develops analytical methods and food sampling plans aimed at improving the accuracy of these data.
"We eat foods but talk about nutrition in terms of food components—vitamins, minerals, fatty acids ..." says Wayne R. Wolf, who recently straddled both laboratories as acting head of the Nutrient Data Laboratory and as an analytical chemist with the Food Composition Laboratory.
"We don't have Recommended Dietary Allowances for broccoli," Wolf notes. "We have RDA's for nutrients broccoli might contain. The USDA databank is the translator."
Ershow says blood cholesterol levels have been dropping over the last 10 to 20 years, according to the Department of Health and Human Services' nationwide health and nutrition examination survey, known as NHANES. "We suspect the drop in cholesterol is due to a drop in the consumption of saturated fat."
Jacqueline L. Dupont, who oversees the nutrition research program for ARS, thinks it's due to an increase in consumption of polyunsaturated fat.
"If you just measure plasma cholesterol and don't measure dietary changes, you're still hanging in the air," says Ershow. The reason for the drop remains unexplained.
NHANES and the USDA Continuing Survey of Food Intakes by Individuals ask people what foods they eat, not what food components. So survey staffers turn to the database to calculate intakes of individual nutrients for each person queried.
In fact, Handbook 8 staffers have developed a separate database for use in NHANES and the USDA survey. Handbook 8—which actually comprises 21 volumes—and its computerized version maintain values for up to 70 nutrients in nearly 6,000 foods.
But Americans are the proverbial kids in a candy store when it comes to food choices, and surveyors record a lot of foods that aren't among the basic 6,000, explains Ruth H. Matthews. She previously stewarded the handbook staff and now leads the research team on composition data.
For new or unusual foods, the staff first request nutrient values from the manufacturers. Then they calculate any missing values based on ingredients. As a result, the database designed for the continuing survey of food intakes includes more foods and sometimes more nutrients. But the values don't always meet standards for inclusion in Handbook 8.
What School kids Are Eating
Handbook 8 staffers are developing another database for the updated USDA school lunch program.
In addition to planning lunches around specific food groups each day, the program now offers the option of meeting specified nutrient, calorie, and fat levels during the course of a week, says Alberta Frost director of child nutrition in USDA's Food and Consumer Service.
So FCS asked Handbook 8 staffers to produce a complete database of all foods in the school lunch program.
It will include nutrient values for basic foods, such as peas and carrots, and for USDA-supplied commodities like beef patties and cheese.
Nutrient values for more than 200 standardized recipes and for a host of processed foods served in school cafeterias will also be included, says Rena Cutrufelli, who oversees the new Child Nutrition Program database.
In many cases, the processed foods sold to schools and other institutions have nutrient values different from Handbook 8 because they are formulated, packaged, or prepared differently, she says. And the FCS wants nutrient values listed by brand name—unlike Handbook 8, which lists most foods generically.
Frost says companies that produce computer software products designed for school lunch planners will be the biggest users of the new database.
In the course of updating the criteria for school lunches, she and her colleagues compared current commercial software products and found that nutrient values varied considerably among them.
"We want the basic reference for foods to be standardized so that everyone will be on a level playing field," says Frost.
Some 22 federal agencies rely on food composition data to make public policy decisions. The Department of Defense uses the data in surveys to evaluate the adequacy of diets for military personnel. Other users include medical researchers, weight reduction program designers, and dietitians who plan meals for hospitals and nursing homes.
"The Handbook 8 databank is the basis for most other food composition databases in this country," notes Matthews.
It is also the basis for the vast majority of Canada's food composition values, she adds. And many other countries that lack the scientific resources and funding to analyze their own foods turn to the USDA data.
Among the biggest users are companies that produce commercial nutrient databases.
Elizabeth Hands, president of Esha Research, a commercial nutrient database company in Salem, Oregon, sees computerized nutrient databases as being "so important for the future in clinics and doctors' offices. The computer can do so many things with this information," she says. "Statistical comparisons showing a connection with what someone eats can be seen so quickly."
Hands says her company uses USDA nutrient data as a base and continually adds missing values taken from new studies in the scientific literature. "None of our work could have been done without the USDA data," she says.
The forerunner of Handbook 8, first published in 1896, gave values for total protein, carbohydrate, fat, and water—known as proximates—as well as for calories, says Matthews.
Now, in addition to the proximates and calories, the handbook lists all important amino acids and fatty acids, as well as fiber, nine vitamins, and nine minerals.
Much of the information—about 85 percent—comes from food industry sources. In the past, there was often little information on the methods used to produce the values. But that is changing, thanks to the needs of the food service industry itself and to computer networking that allows worldwide access to data.
Standardizing Nutrient Data
Four years ago, the International Foodservice Distributors Association (IFDA) formed a committee to standardize the way in which food manufacturers supply information about their products, including nutrient values. Their customers—the food service industry—were clamoring for more complete information on what is in the foods they buy. And they wanted it reported in a standard format that was easily accessible so comparisons could be made.
When Ellen C. Hurley of the ARS Nutrient Data Laboratory learned about the committee's work, she saw the opportunity for handbook staffers to get the kind of documentation they needed to decide whether manufacturer-supplied data met quality criteria. Wolf and Hurley urged the IFDA committee to add quality control documentation to the standard format, and the committee agreed.
This month, IFDA is announcing adoption of a standard format that incorporates Handbook 8 needs. It is also announcing its intention to develop a clearinghouse for product information—a sort of one-stop shopping for data, says Wolf. As it is now, "we have to contact each food manufacturer for nutrient data and wait for them to find the data we need. The new system will speed the process tremendously."
|
|
The next step is to persuade all food manufacturers to use the standard format. Wolf says some of the larger companies are already using an earlier version because they saw the advantages.
The quality of nutrient data is also receiving renewed scientific attention.
Last summer, USDA's Human Nutrition Information Service—the parent agency of the former Nutrient Data Research Branch—rejoined ARS after 13 years as a separate agency. The newly formed Nutrient Data Laboratory is now part of the Beltsville (Maryland) Human Nutrition Research Center, along with the Food Composition Laboratory.
The handbook staff is identifying and improving data for the 500 key foods—the main contributors of calories, vitamins, minerals, fat, fiber and other nutrients in the U.S. diet.
The key foods are chosen from the USDA food consumption survey, based on the amount and frequency of consumption. They are seldom the richest sources of nutrients. Liver, for instance, is rich in many vitamins and minerals but isn't among the top 10 sources for any nutrient.
"People don't recognize the complexity of U.S. foods," says Wolf. "Do you treat macaroni and cheese as a single food or separately under pasta and dairy categories?" he asks. It's not a hypothetical question: a lot of college students survive on macaroni and cheese.
Under the merger with ARS, laboratory staff are developing generic criteria for evaluating the quality of data across the range of nutrients and foods. These are being incorporated into the food industry standards. As a result, the industry will supply documentation necessary for evaluating nutrient data.
The whole question of nutrient data quality goes back nearly 20 years, to a discovery by Wolf and colleagues shortly after the Food Composition Laboratory set up shop.
Because the grading standards for beef had been changed, FCL chemists working with ARS meat scientists and Handbook 8 staff were asked to develop a nutrient profile for beef based on the new grading.
Wolf got values for iron content that differed substantially from Handbook 8 values. "That was the switch that turned on the questions about food analytical data," he says. With a little sleuthing, he found that the handbook's iron values had been estimated, or factored, based on the amount of protein in a food—rather than analyzed directly.
And because the scientist who had developed the factor way back in 1907 subsequently became prominent in the nutrition field, no one seriously questioned it, says Wolf.
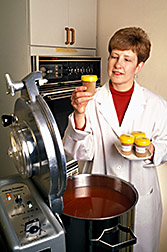
Plant foods can cause even more headaches, says Joanne M. Holden, who is currently the acting head of the Nutrient Data Laboratory. In her regular job, she develops statistically based plans for sampling food for the Food Composition Laboratory.
Holden points out that nutrient values for grains, fruits, and vegetables can vary depending on the plant variety, growing climate, type of soil, processing technique, handling, and storage. So food samples need to be purchased from grocery chains in the major cities representing each region or collected from the major food suppliers for each region.
Matthews notes, "Picking up a mango in the supermarket and having it analyzed is not going to give you the same values for vitamin A as found in Handbook 8. We had mangoes imported from around the world for analysis."
But even with the best quality control, Handbook 8 will never be finished. It's continually being updated with new and improved data as the food supply changes and as analytical methods become more and more precise. "Accuracy is a moving target," notes Elizabeth Hands.
New values for beef were published in 1990 after consumer demand for leaner meat pushed the industry to produce cattle with less marbling and butchers to trim more fat from the cuts. They were updated again last year. And the cholesterol value of eggs was reduced by 22 per cent in 1989, thanks to better analytical methods for determining cholesterol, to better food sampling, and to quality control materials developed in part by Holden and Wolf.
And then there are the budding new nutrients that keep surfacing as science continues to comb the globe for the diet-health relationship. — By Judy McBride, ARS.
Rena Cutrufelli is with the USDA-ARS Nutrient Data Laboratory, 10300 Baltimore Avenue, Beltsville, MD, 20705-2350; phone (301) 504-0693, fax (301) 504-0692.
Wayne R Wolf is with the USDA-ARS Food Composition Laboratory, 10300 Baltimore Ave., Beltsville, MD, 20705-2350; phone (301) 504-8356, fax (301) 5504-8314.
Data You Can Trust
Joanne M. Holden, a nutritionist in the ARS Food Composition Laboratory (FCL), has led the effort to develop an expert system for rating nutrient data quality. In the 1980's, the National Cancer Institute wanted information on selenium levels in foods because the element was being investigated as an anticancer agent. But little data existed on food levels.
Holden and colleagues scored the values they found in the scientific literature from zero (unacceptable) to three (highly acceptable) much like athletic coaches select their players. For instance, if the analytical methods used was not acceptable, the data didn't even make the first cut. If the method passed the five main criteria, then subcriteria were scored to produce this quality index.
Later, ARS computer specialists Steven Heller and Douglas Bigwood worked with Holden and FCL colleagues to develop an expert system to evaluate carotenoid data.
Holden says the expert system incorporates a decision tree to simulate the human decision-making process at each step. And all of it fits on a 3-½-inch disk. Ultimately, it produces a confidence code of A, B, or C for data quality.
"There's no bias," says Holden. "We systematized the decisions. That reduces variability in the decision-making process."
She says a project funded by the U.S. Agency for International Development used the expert system with minor changes to compile carotenoid data, especially for developing countries. And Holden is on a task force to assess data quality and problems for INFOODS, the international network of food data systems.
The expert system "lends some degree of standardization to nutrient data quality," says Holden. "This will help with the exchange of data between countries, because all are talking the same language."
She and colleagues are now working with a computer specialist to develop a generic system for the range of foods and nutrients. — By Judy McBride, ARS.
"Nutrient Accountants" was published in the May 1995 issue of Agricultural Research magazine.